

部署prometheus+pushgateway+node_exporter+opengauss_exporter+grafana看护openGauss数据库
发表于 2026/04/22
0
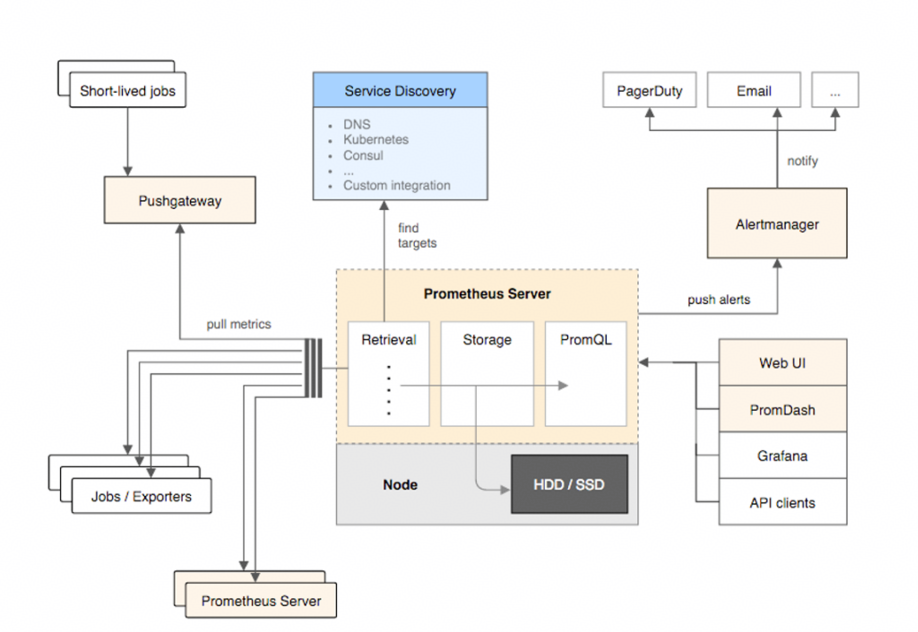
如上图所示,Prometheus运维系统主要由三部分组成:运维数据采集(上图左)、运维数据存储处理(上图中)、运维数据显示上报(上图右)
- exporters
该工具用于将Prometheus不能识别的指标数据转换为Prometheus能识别的指标数据,它可以将各种应用程序、服务、操作系统等的指标数据暴露为HTTP接口,供Prometheus Server采集。
- pushgateway
该工具用于将短期任务的指标数据推送到Prometheus Server,它允许应用程序主动将看护指标数据推送到pushgateway,而不用等待Prometheus Server的定期采集。
- node_exporter
该工具用于收集Linux/Unix系统指标数据,它可以收集CPU、内存、磁盘、网络等系统指标数据,并将其暴露给Prometheus进行看护;它可以通过HTTP或HTTPS协议暴露指标数据,Prometheus可以通过配置文件或者命令行参数来指定node_exporter的地址和端口。
- opengauss_exporter
该工具用于收集openGauss数据库指标数据的exporter,它可以用于收集openGauss数据库的连接数、查询数、事务数、表空间使用情况等指标数据,并将其暴露给Prometheus进行看护;opengauss_exporter可以通过JDBC协议连接到openGauss数据库,并通过HTTP或HTTPS协议暴露指标数据,Prometheus可以通过配置文件或命令行参数来指定opengauss_exporter的地址和端口。
- Prometheus Server
负责从上述各种数据源采集指标数据,并将其存储到自带的时间序列数据库(TSDB)中;它可以用内置的查询语言PromQL来查询分析这些数据,以生成有用的警报和图表。
- altermanager
该组件用于处理和发送警报,它可以与Prometheus Server集成,接收来自Prometheus Server的警报,并根据用户自定义的规则进行处理和发送;它可以将警报发送到各种目标,包括电子邮件、Slack、PagerDuty等。
- grafana
该工具能对Prometheus的数据进行分析,它可以Prometheus的指标数据转换为各种图表、仪表盘等形式,方便用户进行数据分析和看护。
2.1部署顺序
为叙述清晰,本次部署顺序为先部署各组件,再部署Prometheus(实际可按任意顺序部署)。
2.2部署环境
(1)Linux: openEuler 20.03, arm64架构,三台
(2)openGauss: 一主二备,端口:15400;运维库:tpcc;主节点:20.20.20.139;备一:20.20.20.141;备二: 20.20.20.143; 版本:6.0.0
3.1 下载解压
- 下载地址
https://github.com/prometheus/pushgateway/releases
- 选择合适版本,根据本次部署环境,选择pushgateway-1.4.3.linux-arm64.tar.gz
wget https://github.com/prometheus/pushgateway/releases/v1.4.3/pushgateway-1.4.3.linux-arm64.tar.gz
tar -zxvf pushgateway-1.4.3.linux-arm64.tar.gz
注意:github下载较慢,若无法下载,请根据自身部署环境选择合适的镜像版本下载
3.2 准备自定义python脚本
进入解压目录,创建看护脚本prome.py,使用python脚本主动将看护指标数据推送到pushgateway,脚本检测项:CPU、系统内存、磁盘、tpmc、new_order、fd、Inode、IO等。
- 启动看护脚本
nohup python3 master_prome_collection.py > master_prome_collection.log 2>&1 &
2. 启动pushgateway
nohup ./pushgateway > pushgateway.log 2>&1 &
3. 查看master_prome_collection.log和pushgateway.log,正常推送且无报错即可

根据以上步骤,给三台主机都部署pushgateway。
4.1 下载解压
- 下载地址
- 选择合适版本,根据本次部署环境,选择node_exporter-1.7.0.linux-arm64.tar.gz
wget https://github.com/prometheus/node_exporter/releases/download/v1.7.0/node_exporter-1.7.0.linux-arm64.tar.gz
tar -zxvf node_exporter-1.7.0.linux-arm64.tar.gz
4.2 启动
- 进入解压目录,启动node_exporter
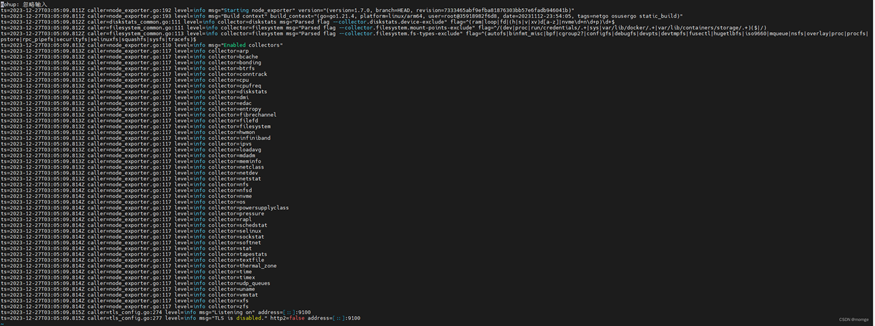
nohup ./node_exporter > node_exporter.log 2>&1 &
2. 查看node_exporter.log,无报错即可
根据以上步骤,给三台主机都部署node_exporter。
4.3 保存json文件
需要将node_exporter对应的json文件保存到本地,后面部署grafana时会用到,文件可到grafana官网获取:
https://grafana.com/grafana/dashboards/
也可到以下地址获取:
5.1 数据库准备
- 安装openGauss数据库,本次部署为一主二备
- 配置md5加密
gs_guc reload -N all -I all -c "password_encryption_type=1"
gs_guc set -N all -I all -h "host all all 20.20.20.139/32 md5"
gs_om -t restart
3. 创建并登录运维库,创建看护管理员
create database tpcc;
gsql gsql -d tpcc -p 15400 -U origin_user -W db_password -r
create user opengauss_exporter with monadmin password '******';
grant usage on schema dbe_perf to opengauss_exporter;
grant select on pg_stat_replication to opengauss_exporter;
当前版本若要统计复杂语句还需要sysadmin角色
alter role opengauss_exporter sysadmin;
以上步骤只需在主节点执行。
5.2 编译环境准备
opengauss_exporter的编译依赖go 1.15及以上版本(运行不需要)
yum install -y golang
go version
5.3 下载及编译
- 下载地址
https://gitcode.com/opengauss/openGauss-prometheus-exporter
- 编译
git clone https://gitcode.com/opengauss/openGauss-prometheus-exporter.git
cd openGauss-prometheus-exporter
make build
编译后生成bin/opengauss_exporter
5.4 启动
- 注册环境变量
export DATA_SOURCE_NAME="host=20.20.20.139 user=opengauss_exporter password=****** port=15400 dbname=tpcc sslmode=disable"
或
export DATA_SOURCE_NAME="postgresql://opengauss_exporter:******@20.20.20.139:15400/tpcc"
2. 启动opengauss_exporter
nohup ./bin/opengauss_exporter --config="default_all.yml" >> opengauss_exporter.log 2>&1 &
3. 查看日志,无报错即可
将opengauss_exporter编译好之后,传到另外两台主机上,依以上步骤启动。
5.5 保存json文件
进入dashboard目录,将以下两个json文件保存到本地,后面部署grafana时会用到(OS.json与node_exporter对应的json文件功能重复,不必保存)
detail.json overview.json
6.1 下载解压
- 下载地址
https://github.com/prometheus/prometheus/releases
- 选择合适版本,根据本次部署环境,这里选择prometheus-2.49.0-rc.2.linux-arm64.tar.gz
wget https://github.com/prometheus/prometheus/releasesv2.49.0-rc.2/prometheus-2.49.0-rc.2.linux-arm64.tar.gz
tar -zxf prometheus-2.49.0-rc.2.linux-arm64.tar.gz
6.2 修改配置文件
解压后,根据环境情况修改prometheus.yml文件,本次部署的配置示例如下:
# my global config
# 默认配置可不用修改
global:
scrape_interval: 15s # Set the scrape interval to every 15 seconds. Default is every 1 minute.
evaluation_interval: 15s # Evaluate rules every 15 seconds. The default is every 1 minute.
# scrape_timeout is set to the global default (10s).
# Alertmanager configuration
alerting:
alertmanagers:
- static_configs:
- targets:
# - alertmanager:9093
# Load rules once and periodically evaluate them according to the global 'evaluation_interval'.
rule_files:
# - "first_rules.yml"
# - "second_rules.yml"
# A scrape configuration containing exactly one endpoint to scrape:
# Here it's Prometheus itself.
scrape_configs:
# The job name is added as a label `job=<job_name>` to any timeseries scraped from this config.
- job_name: "prometheus"
# metrics_path defaults to '/metrics'
# scheme defaults to 'http'.
static_configs:
- targets: ["localhost:9090"] # prometheus部署的ip及端口
- job_name: 'pushgateway' # 任务目标名,可以理解成分组,每个分组包含具体的target组员,以下三个targets分别配置三台主机上的pushgateway。
static_configs:
- targets: ['20.20.20.139:9091'] # pushgateway部署的ip及端口,端口建议配成默认的9091
labels:
instance: pushgateway_pri # 看护项标签,会在grafana显示,建议配成有意义的字符串(比如这个就代表主节点上部署的pushgateway)
- targets: ['20.20.20.141:9091']
labels:
instance: pushgateway_st1
- targets: ['20.20.20.143:9091']
labels:
instance: pushgateway_st2
- job_name: 'node_exporter' # 任务目标名,可以理解成分组,每个分组包含具体的target组员,以下三个targets分别配置三台主机上的node_exporter。
static_configs:
- targets: ['20.20.20.139:9100'] # node_exporter部署的ip及端口,端口建议配成默认的9100
labels:
instance: node_exporter_pri # 看护项标签,会在grafana显示,建议配成有意义的字符串(比如这个就代表主节点上部署的node_exporter)
- targets: ['20.20.20.141:9100']
labels:
instance: node_exporter_st1
- targets: ['20.20.20.143:9100']
labels:
instance: node_exporter_st2
- job_name: 'opengauss_exporter' # 任务目标名,可以理解成分组,每个分组包含具体的target组员,以下三个targets分别配置三台主机上的opengauss_exporter。
static_configs:
- targets: ['20.20.20.139:9187'] # opengauss_exporter部署的ip及端口,端口建议配成默认的9187
labels:
instance: opengauss_exporter_pri # 看护项标签,会在grafana显示,建议配成有意义的字符串(比如这个就代表主节点上部署的opengauss_exporter)
- targets: ['20.20.20.141:9187']
labels:
instance: opengauss_exporter_st1
- targets: ['20.20.20.143:9187']
labels:
instance: opengauss_exporter_st2
6.3 启动
- 进入解压目录,启动prometheus
nohup ./prometheus --config.file=prometheus.yml > prometheus.log 2>&1 &
2. 查看日志,无报错即可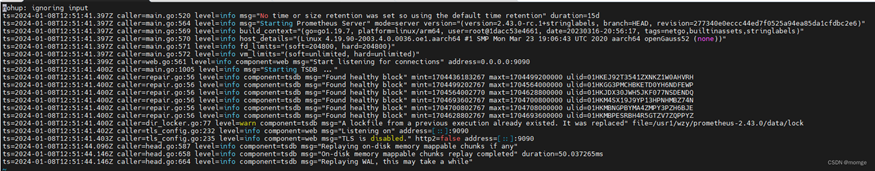
3. 查看各看护项状态
浏览器访问prometheus部署的ip:port/targets,可查看各看护项的状态
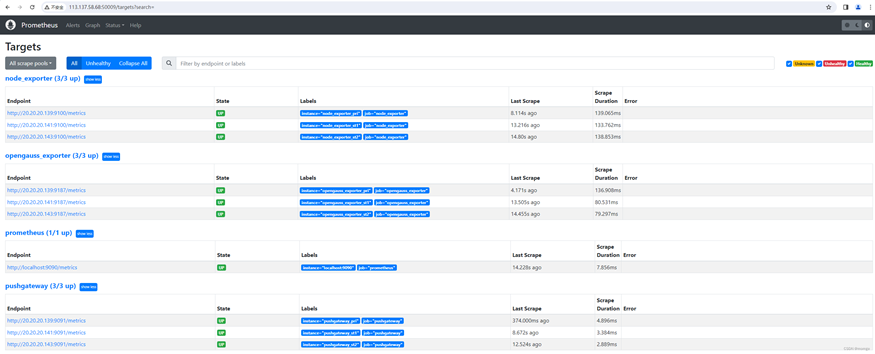
若图中state字段显示为UP,则说明各看护项状态正常,若显示为DOWN,则说明对应的看护组件没有正常启动,需进一步排查。
7.1 yum安装
yum install -y https://dl.grafana.com/enterprise/release/grafana-enterprise-10.2.3-1.aarch64.rpm
7.2 启动
- 启动/停止/重启grafana
systemctl start/stop/restart grafana-server.service
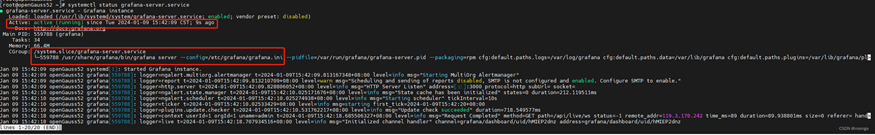
2. 查看grafana状态,无报错即可
systemctl status grafana-server.service
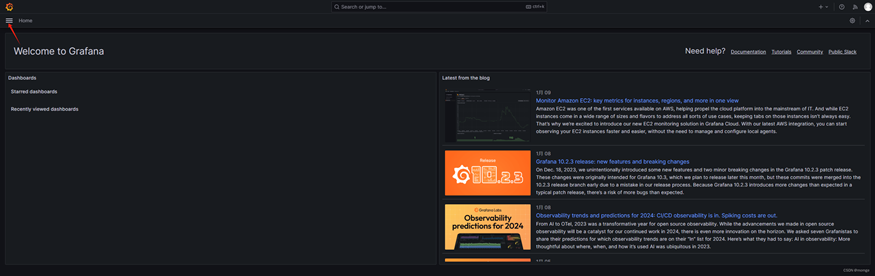
3. 访问grafana
浏览器访问granana部署的ip:port,默认端口为3000,初始用户和密码均为admin,登录后需修改密码
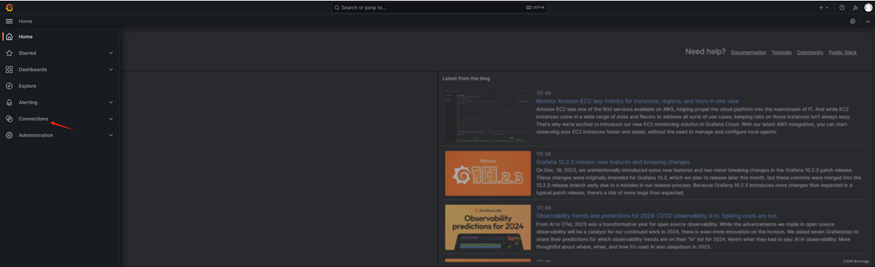
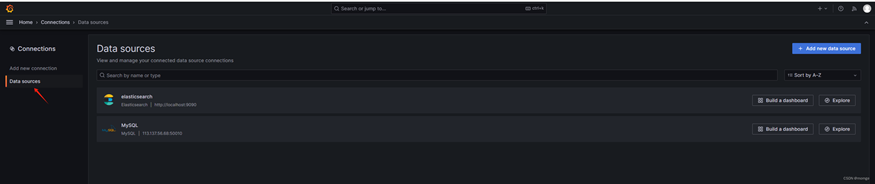
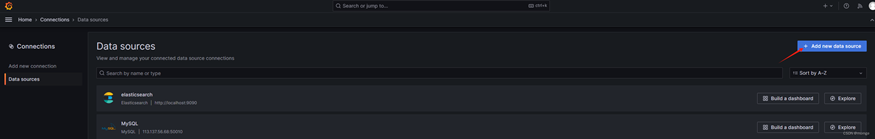
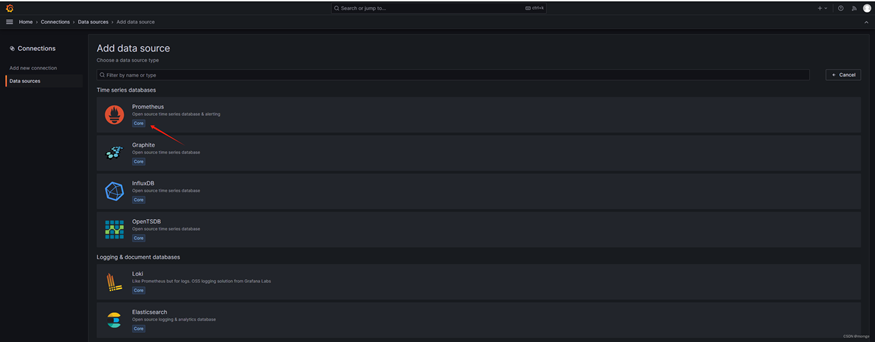
7.3 添加prometheus数据源
登录grafana后,根据以下顺序将前面部署的prometheus添加到grafana(注意:grafana不同版本之间界面有所不同,本次演示以前面部署的grafana-enterprise-10.2.3-1版本为例)
配置数据源的name和prometheus的url: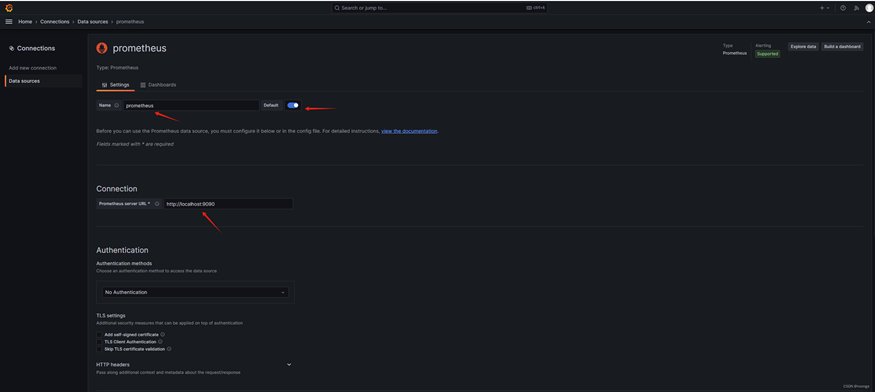
HTTP method 设为GET,测试连接并保存数据源,出现成功提示即可: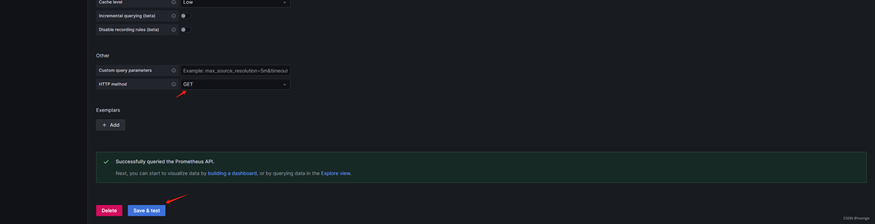
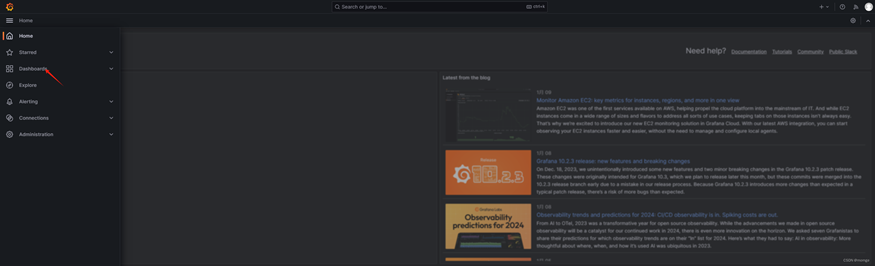
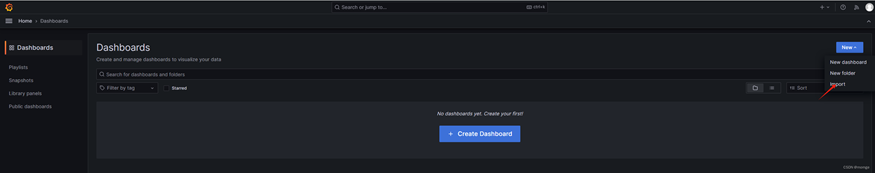
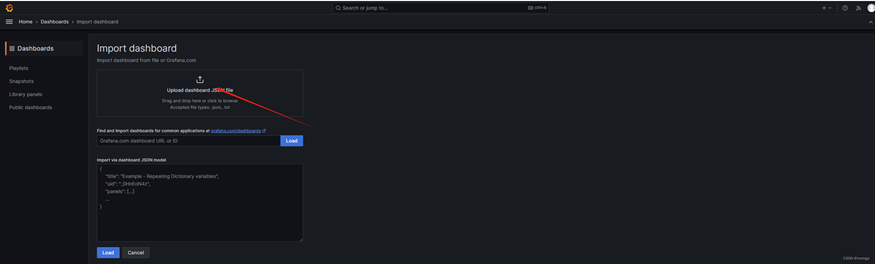
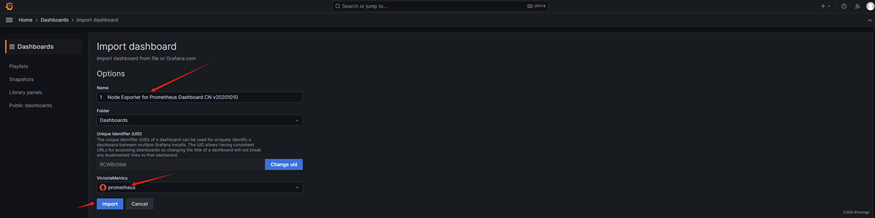
7.4 导入json文件
根据以下步骤,将前面保存的node-exporter-for-prometheus-dashboard-cn-v20201010_rev24.json、detail.json、overview.json导入grafana
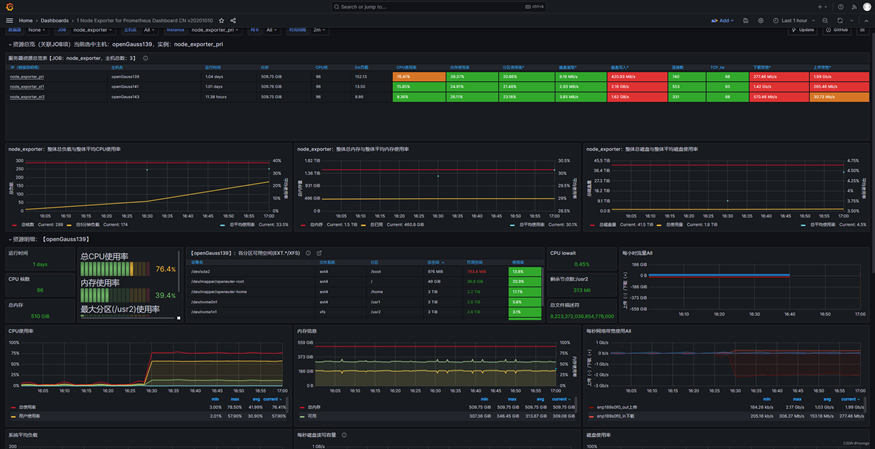
7.5 效果展示
- node_exporter看护界面