LoadsMetric基本使用
LoadsMetric为集群负载采集与分析工具,支持安装、卸载、启动、停止等操作,同时,支持一键启停Prometheus、Node Exporter、Grafana其他相关软件。
查看使用命令
- 进入server1节点的“/home/hadoop/loadsmetric-software”目录。
cd /home/hadoop/loadsmetric-software
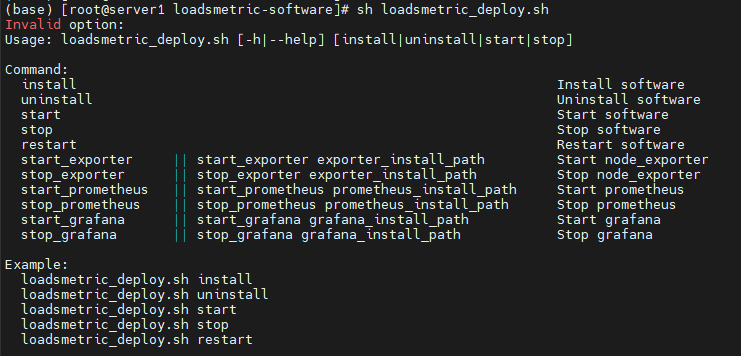
- 执行sh loadsmetric_deploy.sh查看脚本运行方法。
sh loadsmetric_deploy.sh
LoadsMetric服务基本运维方法
脚本执行建议进入到脚本放置目录中执行。
1
|
cd /home/hadoop/loadsmetric-software/ |
- 安装LoadsMetric。
1sh loadsmetric_deploy.sh install
- 卸载LoadsMetric。
1sh loadsmetric_deploy.sh uninstall
- 启动LoadsMetric。
1sh loadsmetric_deploy.sh start
- 停止LoadsMetric。
1sh loadsmetric_deploy.sh stop
- 重启LoadsMetric。
1sh loadsmetric_deploy.sh restart
LoadsMetric日志配置方法
- 打开日志配置文件。
1vi /home/hadoop/loadsmetric-install/loadsmetric-server/etc/logback.xml - 按“i”进入编辑模式,按需修改如下参数。
1
2
3
4
5
6
<!--LOG FILE RETENTION DAYS -->   #设置保留的历史日志文件天数
<MaxHistory>30</MaxHistory>
<!-- LOG FILE MAX SIZE -->        #设置单个日志文件的最大大小
<MaxFileSize>2000MB</MaxFileSize>
<!-- LOG FILE TOTAL SIZE CAP -->    #设置所有日志文件占用磁盘空间的总上限
<TotalSizeCap>20GB</TotalSizeCap>
- 按“Esc”键,输入:wq!,按“Enter”保存并退出编辑。
LoadsMetric一键启停Prometheus、Node_exporter、Grafana
一键启停Prometheus、Node_exporter、Grafana命令请参见表1。
|
序号 |
功能 |
命令 |
说明 |
|---|---|---|---|
|
1 |
一键启动node_exporter |
sh loadsmetric_deploy.sh start_exporter |
node_exporter安装目录为默认路径“/opt/prometheus/node_exporter-1.7.0.linux-arm64/”时,一键启动所有agent节点的node_exporter。 |
|
sh loadsmetric_deploy.sh start_exporter "安装路径" 如:sh loadsmetric_deploy.sh start_exporter “/opt/prometheus/node_exporter-1.7.0.linux-arm64” |
node_exporter安装目录为其他路径时,一键启动所有agent节点的node_exporter。 |
||
|
2 |
一键停止node_exporter |
sh loadsmetric_deploy.sh stop_exporter |
一键停止所有agent节点的node_exporter。 |
|
3 |
一键启动Prometheus |
sh loadsmetric_deploy.sh start_prometheus |
Prometheus安装目录为默认路径“/opt/prometheus/prometheus-2.45.4.linux-arm64/”时,一键启动server节点的Prometheus。 |
|
sh loadsmetric_deploy.sh start_prometheus "安装路径" 如:sh loadsmetric_deploy.sh start_prometheus “/opt/prometheus/prometheus-2.45.4.linux-arm64” |
Prometheus安装目录为其他路径时,一键启动server节点的Prometheus。 |
||
|
4 |
一键停止Prometheus |
sh loadsmetric_deploy.sh stop_prometheus |
一键停止server节点的Prometheus。 |
|
5 |
一键启动Grafana |
sh loadsmetric_deploy.sh start_grafana |
Grafana安装目录为默认路径“/opt/prometheus/grafana-v10.4.2/bin/”时,一键启动server节点的Grafana。 |
|
sh loadsmetric_deploy.sh start_grafana "安装路径" 如:sh loadsmetric_deploy.sh start_grafana “/opt/prometheus/grafana-v10.4.2/bin” |
Grafana安装目录为其他路径时,一键启动server节点的Grafana。 |
||
|
6 |
一键停止Grafana |
sh loadsmetric_deploy.sh stop_grafana |
一键停止server节点的Grafana。 |