Memory Latency Tester Functions
The Memory Latency Tester is a memory bandwidth benchmark tool for the Kunpeng platform. It is used to analyze the relationship between memory bandwidth and latency, and measure how latency changes as bandwidth increases. The tool helps evaluate the overall performance of the memory subsystem on Kunpeng servers. For accurate measurements, you are advised to run the tool when the system is idle. The tool can run on some of servers powered by the Kunpeng 920 new model or Kunpeng 950 processor.
Prerequisites
- The Memory Latency Tester has been installed.
- The tool is contained in an independent package (KunpengMemoryLatencyTester-x.x.x-Linux-aarch64.tar.gz). Extract the package and switch to the tool directory.
- The tool depends on the numactl command. Before using the tool, ensure that numactl has been installed. If numactl has not been installed, run the following command to install it:
yum install numactl
Command Function
Collects and displays memory bandwidth and latency data.
Directory Description
The directory structure after extracting the tool package is as follows:
KunpengMemoryLatencyTester
├── Kunpeng DevKit License Agreement 1.0.txt
├── bin
│   ├── kmlt_bw
│   └── latency
├── kmlt
├── Kunpeng DevKit License Agreement 1.0.txt
└── lib
    ├── libkperf_collect.so
    ├── libkperf.so
    └── libsym.so
The bin and lib directories contain the runtime dependencies of the tool, and kmlt is the entry point of the command-line tool.
Syntax
Based on the test object type, data is collected in the following two cases:
- Specify the NUMA node where the test CPU is located or the NUMA node from which memory is allocated for testing:
./kmlt [-h | --help] [-c | --cpu-node <node_cpu>] [-m | --mem-node <node_mem>] [-M | --mode <mode>[,<mode>...]] [-d | --detail <nops>[,<nops>...]]
- Specify the socket for the test.
./kmlt [-h | --help] -s | --socket <socket> [-M | --mode <mode>[,<mode>...]] [-d | --detail <nops>[,<nops>...]]
Parameter Description
|
Parameter |
Option |
Description |
|---|---|---|
|
-h/--help |
- |
(Optional) Obtains help information. |
|
-M/--mode |
rd/wr/rdwr/rdwr21/all |
(Optional) Specifies the test mode, such as the read or write mode or a mixed mode. The default value is all.
|
|
-d/--detail |
nops |
(Optional) Sets the bandwidth and latency data for tests in different nops scenarios. By default, the result report contains eight groups of data (nops is set to 2000,1000,600,300,100,40,10,0 by default). Use commas (,) to separate different nops parameters. The value range of nops is 0 ≤ nops < 10000. A maximum of 100 groups of data are supported. Example: ./kmlt -d 2000,1000,500. |
|
Parameter |
Option |
Description |
|---|---|---|
|
-c/--cpu-node |
node_cpu |
(Optional) Specifies the NUMA node where the test CPU is located. The default value is 0. (This parameter is mutually exclusive with -s.) |
|
-m/--mem-node |
node_mem |
(Optional) Specifies the NUMA node from which memory is allocated. The default value is 0. (This parameter is mutually exclusive with -s.) |
|
Parameter |
Option |
Description |
|---|---|---|
|
-s/--socket |
socket |
This parameter is required when specifying a socket for testing. By default, local memory is used. (This parameter is mutually exclusive with -c or -m.) |
Example
- Perform a read-mode stress test on the NUMA node where the CPU and allocated memory are located, and collect and display memory bandwidth and latency data.
./kmlt -c 1 -m 1 -M rd

- The parameters -c 1 and -m 1 indicate that the NUMA node of the test CPU and the NUMA node for memory allocation are both NUMA node 1. Replace -c and -m with the actual NUMA node IDs to be tested.
- If a failure message is returned when using the tool, see "unsupport CPU type" Displayed When Using the Tool.
The tool sequentially displays the bandwidth and latency at different memory access intervals. The following figure shows the test results:
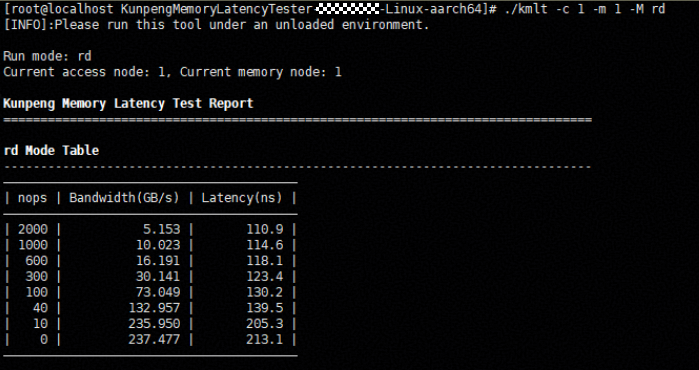
The latency increases slowly as the bandwidth increases. However, when the bandwidth reaches a specific threshold, the latency increases sharply. The sharp latency increase occurs when the bandwidth ranges from 132.957 GB/s to 235.950 GB/s. The tool captures the critical point where latency increases sharply to define the efficient operating range of the memory controller.
Table 4 Report description Item
Description
nops
Memory access interval. A larger value indicates lower bandwidth.
Bandwidth
Bandwidth, in GB/s.
Latency
Memory access latency at the current bandwidth, in ns.
- Perform an all-mode stress test on the specified socket, and collect and display memory bandwidth and latency data.
./kmlt -s 0
- The -s 0 parameter specifies the socket used for testing. Replace -s with the actual socket ID.
- If a failure message is returned when using the tool, see "unsupport CPU type" Displayed When Using the Tool.
The tool sequentially displays the results for the test mode specified in the command. The following figure shows the test results:
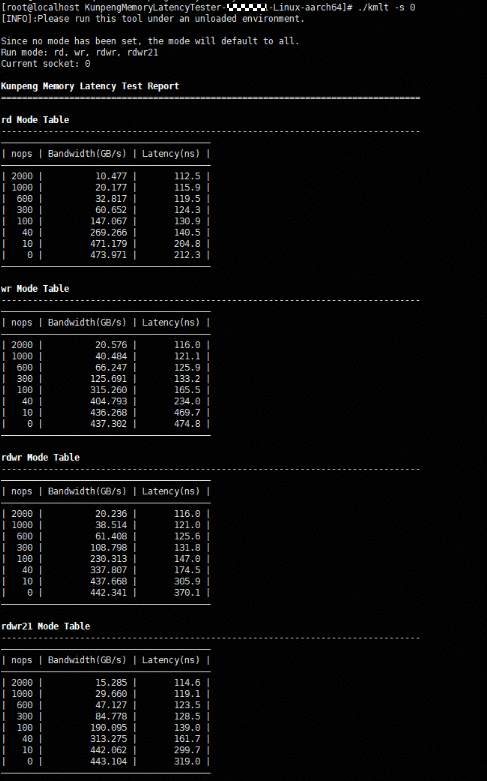
The latency increases slowly as the bandwidth increases. However, when the bandwidth reaches a specific threshold, the latency increases sharply. Based on the data collected in all mode, the sharp latency increase occurs when the bandwidth ranges from 315 GB/s to 440 GB/s. The tool captures the critical point where latency increases sharply to define the efficient operating range of the memory controller.
Table 5 Report description Item
Description
nops
Memory access interval. A larger value indicates lower bandwidth.
Bandwidth
Bandwidth, in GB/s.
Latency
Memory access latency at the current bandwidth, in ns.