Collecting I/O System Call Duration Data
This section briefly demonstrates the end-to-end process of using the Dynamic Code Optimizer to collect and analyze I/O data for a source file. Using the test_directory_ops_daemon.c source file as an example, it collects I/O system call duration data.
Prerequisites
As an example, the Dynamic Code Optimizer is installed in /home/DevKit-Optimizer-CLI-x.x.x-Linux-Kunpeng.
Procedure
- Compile the source file to generate an executable binary file. In the example, the source file path is /home/test/test_directory_ops_daemon.c. Replace it with the actual path.
gcc -o test_directory_ops_daemon test_directory_ops_daemon.c -O2 -g
Content of the test_directory_ops_daemon.c file:
#include <stdio.h> #include <stdlib.h> #include <string.h> #include <unistd.h> #include <fcntl.h> #include <signal.h> #include <time.h> #include <sys/stat.h> #include <sys/types.h> #define BASE_DIR "/tmp/io_test_dir_ops" static volatile int g_running = 1; static double g_mkdir_total_us = 0.0, g_rmdir_total_us = 0.0; static double g_unlink_total_us = 0.0, g_rename_total_us = 0.0; static int g_mkdir_count = 0, g_rmdir_count = 0; static int g_unlink_count = 0, g_rename_count = 0; static int g_seq = 0; static double get_time_us(void) { struct timespec ts; clock_gettime(CLOCK_MONOTONIC, &ts); return ts.tv_sec * 1000000.0 + ts.tv_nsec / 1000.0; } static void handle_signal(int sig) { g_running = 0; } int main(int argc, char *argv[]) { signal(SIGTERM, handle_signal); signal(SIGINT, handle_signal); mkdir(BASE_DIR, 0755); printf("=== Directory Ops Daemon (PID=%d) ===\n", getpid()); fflush(stdout); while (g_running) { int i = __sync_fetch_and_add(&g_seq, 1); char dirpath[512], dstpath[512], filepath[512]; int basefd = open(BASE_DIR, O_RDONLY | O_DIRECTORY); /* --- mkdir + rmdir --- */ snprintf(dirpath, sizeof(dirpath), "%s/mkdir_%d_%d", BASE_DIR, getpid(), i); double t0 = get_time_us(); mkdir(dirpath, 0755); double t1 = get_time_us(); g_mkdir_total_us += (t1 - t0); g_mkdir_count++; t0 = get_time_us(); rmdir(dirpath); t1 = get_time_us(); g_rmdir_total_us += (t1 - t0); g_rmdir_count++; /* --- mkdirat + rmdir --- */ if (basefd != -1) { char dn[256]; snprintf(dn, sizeof(dn), "mkdirat_%d_%d", getpid(), i); t0 = get_time_us(); mkdirat(basefd, dn, 0755); t1 = get_time_us(); g_mkdir_total_us += (t1 - t0); g_mkdir_count++; snprintf(dirpath, sizeof(dirpath), "%s/%s", BASE_DIR, dn); t0 = get_time_us(); rmdir(dirpath); t1 = get_time_us(); g_rmdir_total_us += (t1 - t0); g_rmdir_count++; } /* --- unlink --- */ snprintf(filepath, sizeof(filepath), "%s/unlink_%d_%d", BASE_DIR, getpid(), i); { int fd = open(filepath, O_CREAT | O_WRONLY, 0644); if (fd != -1) close(fd); } t0 = get_time_us(); unlink(filepath); t1 = get_time_us(); g_unlink_total_us += (t1 - t0); g_unlink_count++; /* --- unlinkat --- */ if (basefd != -1) { char fn[256]; snprintf(fn, sizeof(fn), "unlinkat_%d_%d", getpid(), i); snprintf(filepath, sizeof(filepath), "%s/%s", BASE_DIR, fn); { int fd = open(filepath, O_CREAT | O_WRONLY, 0644); if (fd != -1) close(fd); } t0 = get_time_us(); unlinkat(basefd, fn, 0); t1 = get_time_us(); g_unlink_total_us += (t1 - t0); g_unlink_count++; } /* --- rename --- */ snprintf(filepath, sizeof(filepath), "%s/ren_src_%d_%d", BASE_DIR, getpid(), i); snprintf(dstpath, sizeof(dstpath), "%s/ren_dst_%d_%d", BASE_DIR, getpid(), i); { int fd = open(filepath, O_CREAT | O_WRONLY, 0644); if (fd != -1) close(fd); } t0 = get_time_us(); rename(filepath, dstpath); t1 = get_time_us(); g_rename_total_us += (t1 - t0); g_rename_count++; unlink(dstpath); /* --- renameat --- */ if (basefd != -1) { char sn[256], dnn[256]; snprintf(sn, sizeof(sn), "renat_src_%d_%d", getpid(), i); snprintf(dnn, sizeof(dnn), "renat_dst_%d_%d", getpid(), i); snprintf(filepath, sizeof(filepath), "%s/%s", BASE_DIR, sn); { int fd = open(filepath, O_CREAT | O_WRONLY, 0644); if (fd != -1) close(fd); } t0 = get_time_us(); renameat(basefd, sn, basefd, dnn); t1 = get_time_us(); g_rename_total_us += (t1 - t0); g_rename_count++; snprintf(dstpath, sizeof(dstpath), "%s/%s", BASE_DIR, dnn); unlink(dstpath); } if (basefd != -1) close(basefd); usleep(1000); } printf("\n=== Baseline ===\n"); if (g_mkdir_count > 0) printf("mkdir/mkdirat avg=%.2f us count=%d\n", g_mkdir_total_us / g_mkdir_count, g_mkdir_count); if (g_rmdir_count > 0) printf("rmdir avg=%.2f us count=%d\n", g_rmdir_total_us / g_rmdir_count, g_rmdir_count); if (g_unlink_count > 0) printf("unlink/unlinkat avg=%.2f us count=%d\n", g_unlink_total_us / g_unlink_count, g_unlink_count); if (g_rename_count > 0) printf("rename/renameat avg=%.2f us count=%d\n", g_rename_total_us / g_rename_count, g_rename_count); fflush(stdout); rmdir(BASE_DIR); return 0; } - Execute the binary file in the /home/test directory.
./test_directory_ops_daemon
Command output:
=== Directory Ops Daemon (PID=239466) ===
- Keep the program running, go to the Dynamic Code Optimizer tool directory, specify the ID of the test_directory_ops_daemon process, and collect I/O system call duration data to generate a data file.
cd /home/DevKit-Optimizer-CLI-x.x.x-Linux-Kunpeng
./devopt.sh record -p 239466 -d 5 -o /home/test

The process ID is 239466 and the collection duration is 5 seconds. A data file is generated in the /home/test directory.
Command output:
Saved the record data to /home/test/devopt_239466_20260817113411.rawdata
- Enable the refined I/O collection mode to analyze the I/O system call duration data based on the data file.
./devopt.sh record -p 239466 -d 5 --io -i /home/test/devopt_239466_20260817113411.rawdata
- View the analysis result, for example, using the report subcommand.
./devopt.sh report -i /home/test/devopt_239466_20260817113411.rawdata
Command output:
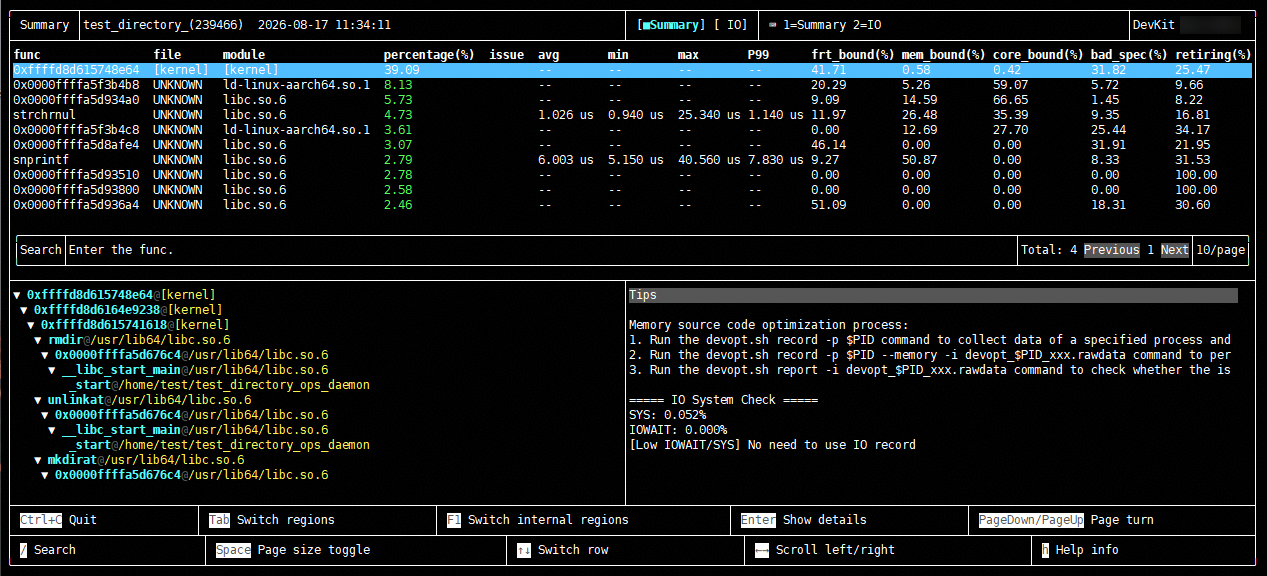
Click the IO data identifier or press 2 to switch to the IO panel. The IO panel displays the following information:
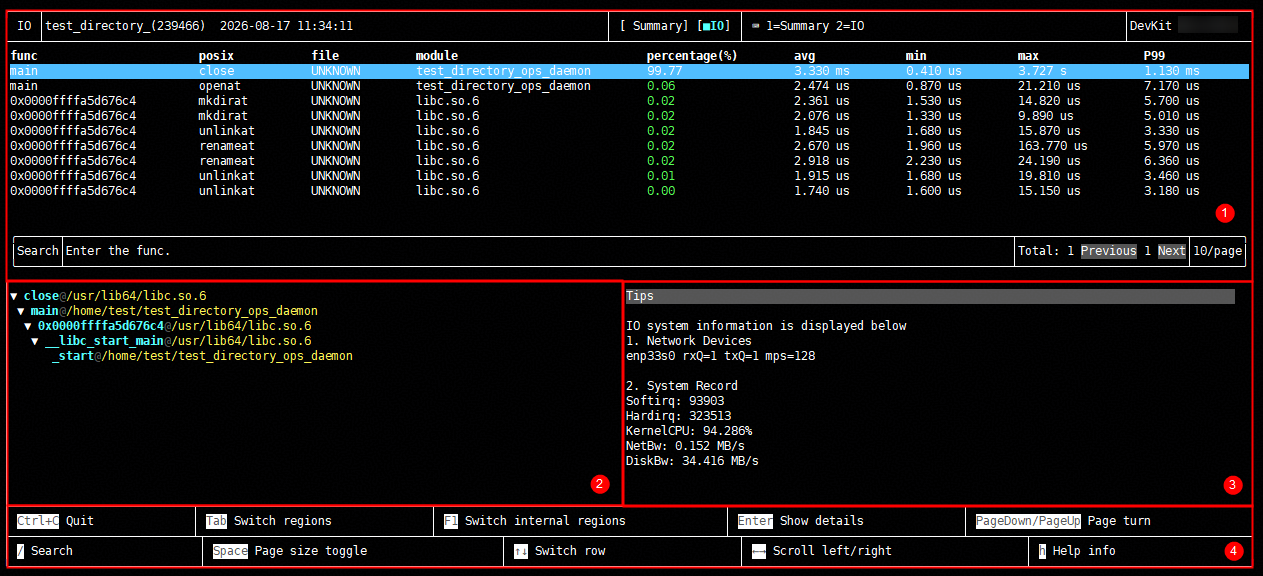
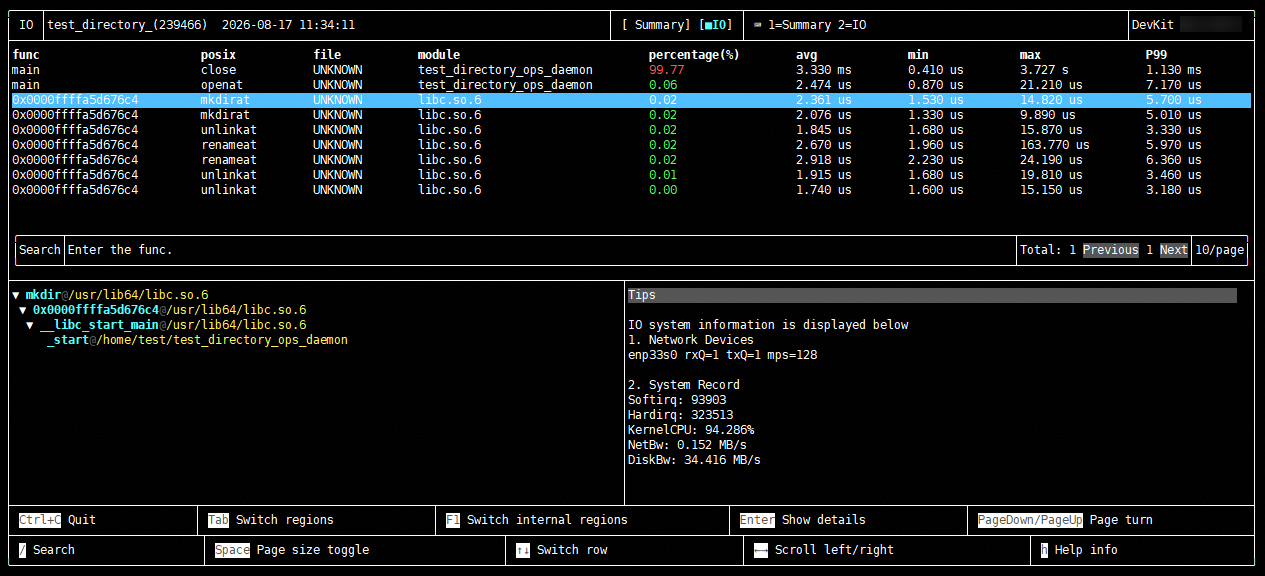
Considering the impact of performance overhead, the default call stack unwinding method is based on the Frame Pointer (
FP ) approach used byPerf . Therefore, when you click an I/O data entry to view the call stack details, the call stack directly skips from the libc syscall wrapper to __libc_start_call_main, with the main function missing in between. This is because call stack collection uses FP-based unwinding. Some syscall wrappers in glibc (such as mkdir, close, and rename) are compiled without frame pointers, causing the FP chain to break at these points. As a result, the stack frame of main cannot be correctly identified.Table 1 IO panel on the tool summary screen Area
Name
Description
1
Table area
Displays function information in the source file. For details about the fields, see Table 2. You can use the search box in the table area to quickly search for a function.
2
Call stack area
Displays function call information. You can press e to collapse or expand the information.
3
Hints area
Displays the collected I/O system call duration data.
4
Shortcut key area
Displays shortcut key information. For details, see Table 3.
Table 2 Fields in the table area Field
Description
func
Name of the function that triggers the I/O system call.
posix
Name of the POSIX system call.
file
Name of the source file containing the caller function.
module
Module to which the caller function belongs.
percentage(%)
Percentage of the function duration to the total duration.
avg
Average duration of the I/O system call function.
min
Minimum duration of the I/O system call function.
max
Maximum duration of the I/O system call function.
P99
99th percentile duration, indicating that 99% of function durations do not exceed this value.
Table 3 Shortcut keys Shortcut Key
Description
Ctrl+C
Exits the current screen and returns to the CLI.
Tab
Switches the selected area within the tool screen.
Enter
Goes to the details screen of the selected data.
F1
Switches within the selected area.
/
Selects the search box.
Space
Displays the data screen size selector.
h
Displays help information.
e
Collapses or expands function call information in the call stack area.
↑/↓
Scrolls the vertical scrollbar up or down.
←/→
Scrolls the horizontal scrollbar left or right.
PageDown/PageUp
Quickly scrolls the vertical scrollbar up or down.
q/Esc
Returns from the tool's details screen to the summary screen.
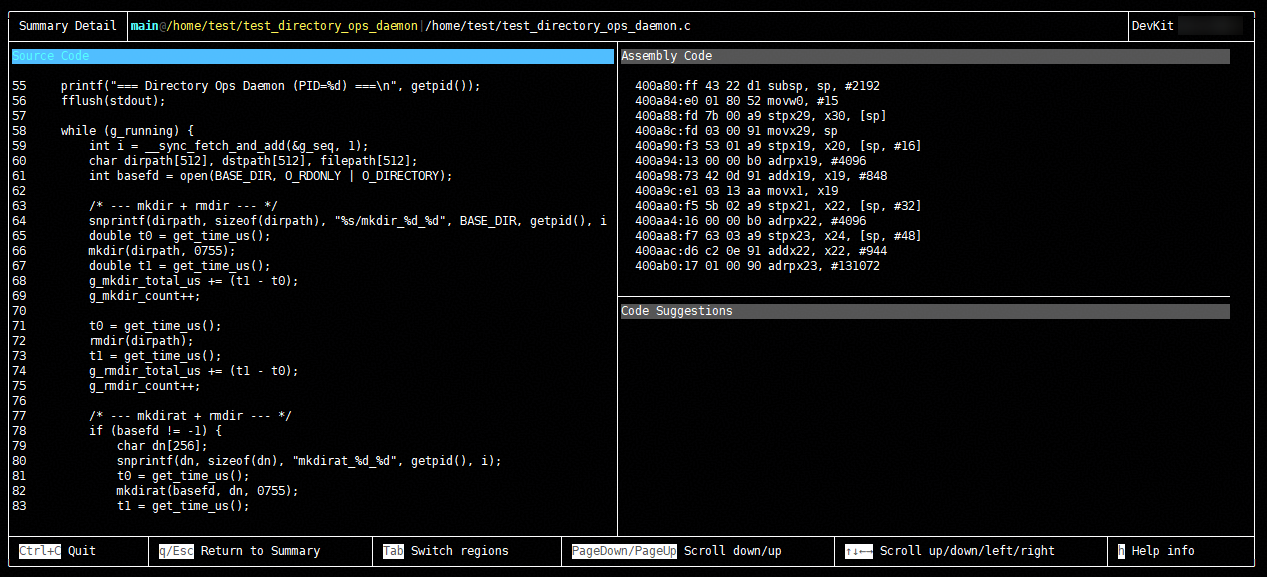
- Select the corresponding I/O data item according to the information displayed in the hints area on the tool summary screen, and press Enter to view the detailed I/O system call duration data, as shown in the following figure: